# Manage PMP analytics graphs and tables
{% hint style="success" %}
**Access Type:** Analytics - Viewer
**Premium Feature**: Preference Management Platform
{% endhint %}
Every PMP analytics dashboard will include a variety of graphs and tables to visualize the data pertaining to the dashboard. In this article, we will cover actions your organization can perform in regards to these visualizations.
* [Show underlying data](#show-underlying-data)
* [Maximize element](#maximize-element)
* [Sort](#sort)
* [Export/Download](#export-download)
* [Refresh data](#refresh-data)
{% hint style="warning" %}
**Note**: The above actions are not available for every data visualization and table.
{% endhint %}
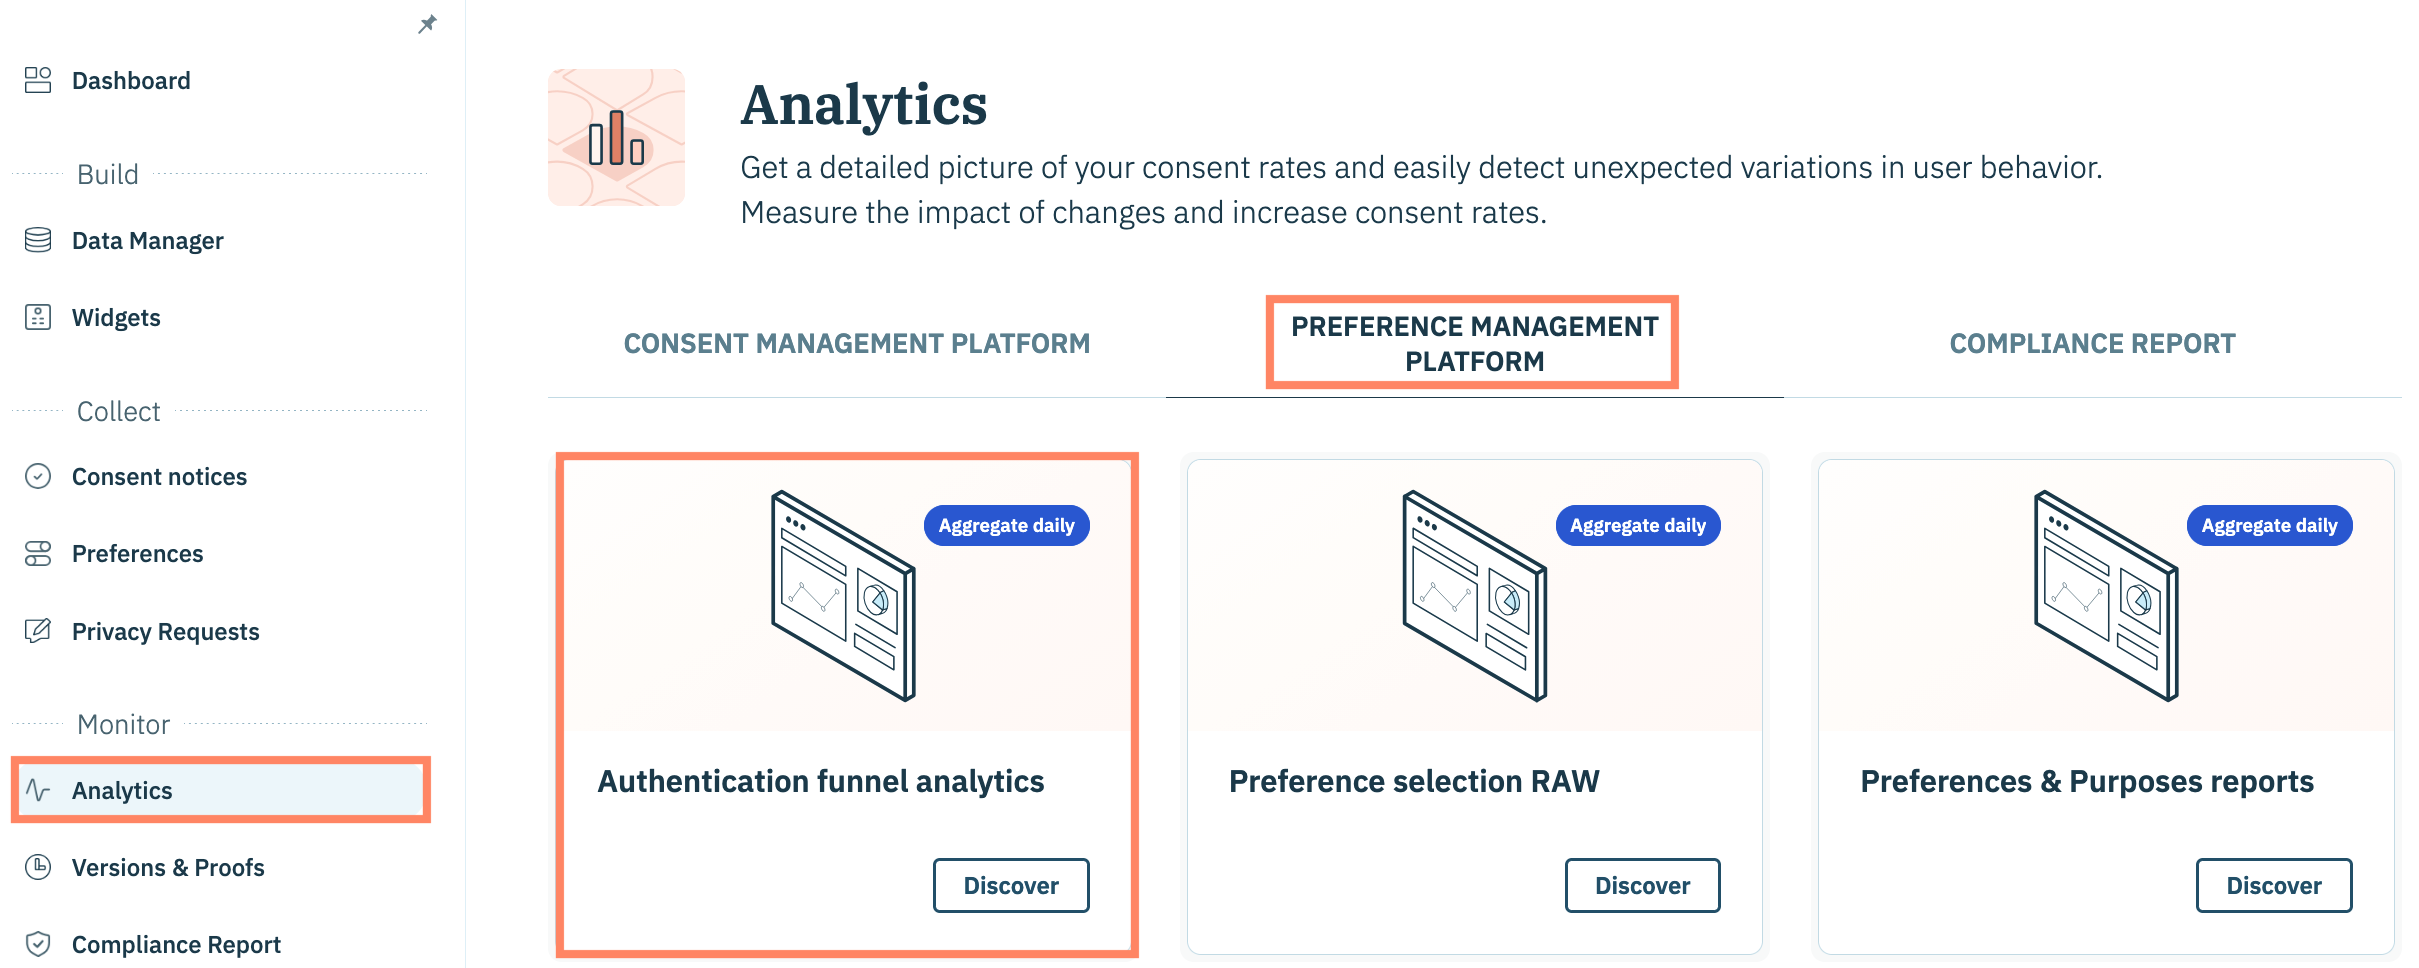
To access the action menu for a visualization, click **Analytics** on the left-hand panel and select the **Preference Management Platform** tab.
Click the card for your desired PMP analytics dashboard.
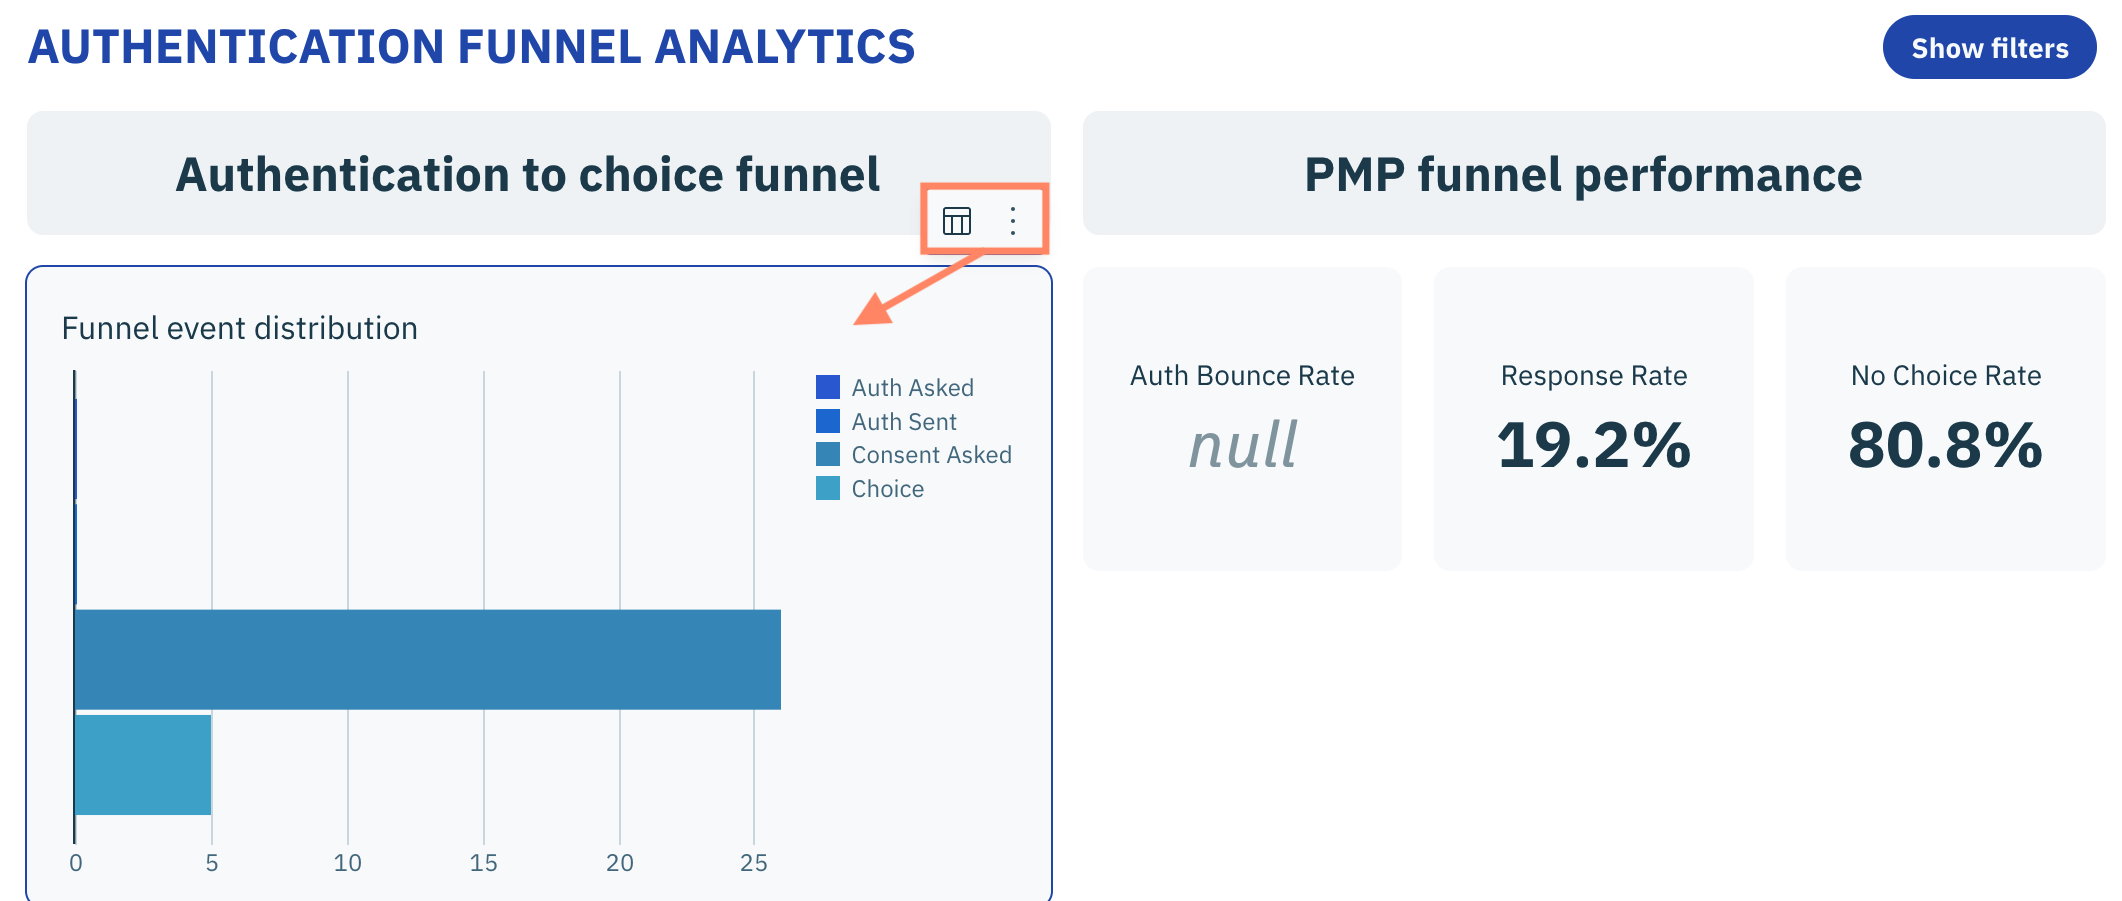
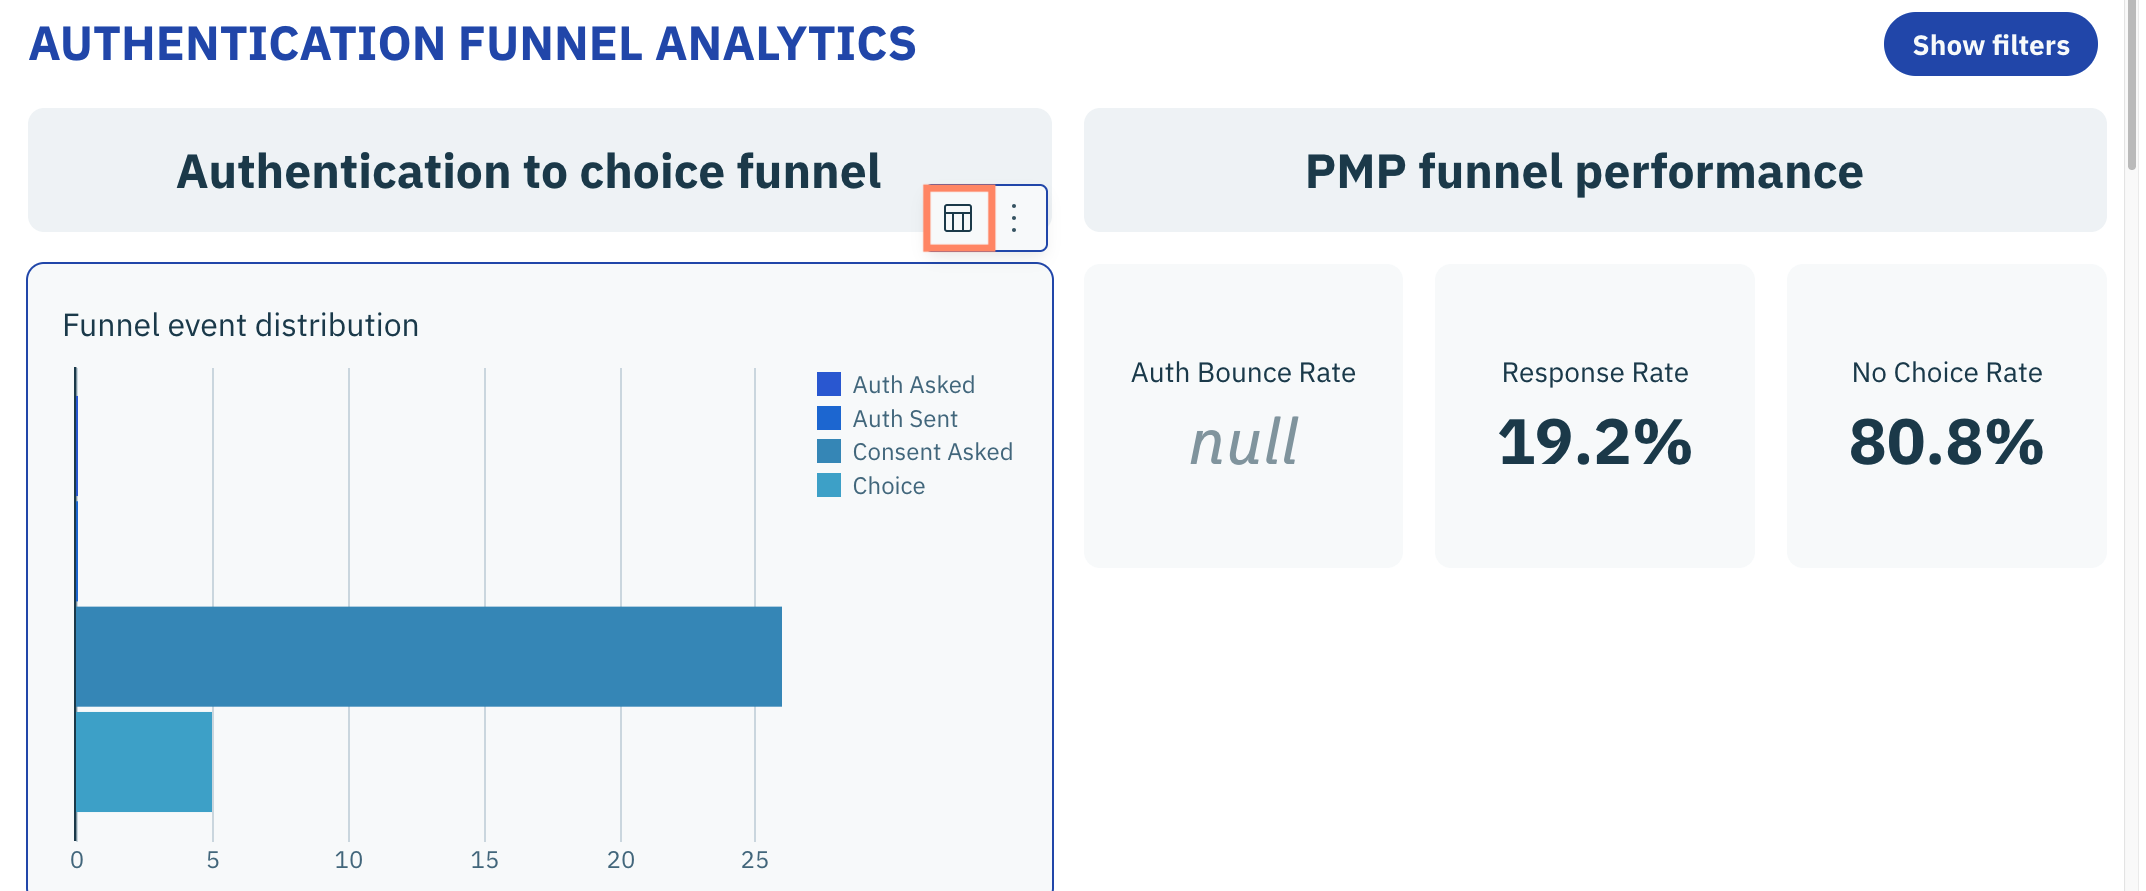
Hover over a visualization and use the provided menu to select an action.
***
### Show underlying data
Select the **Show underlying data** icon from the action menu for the visualization
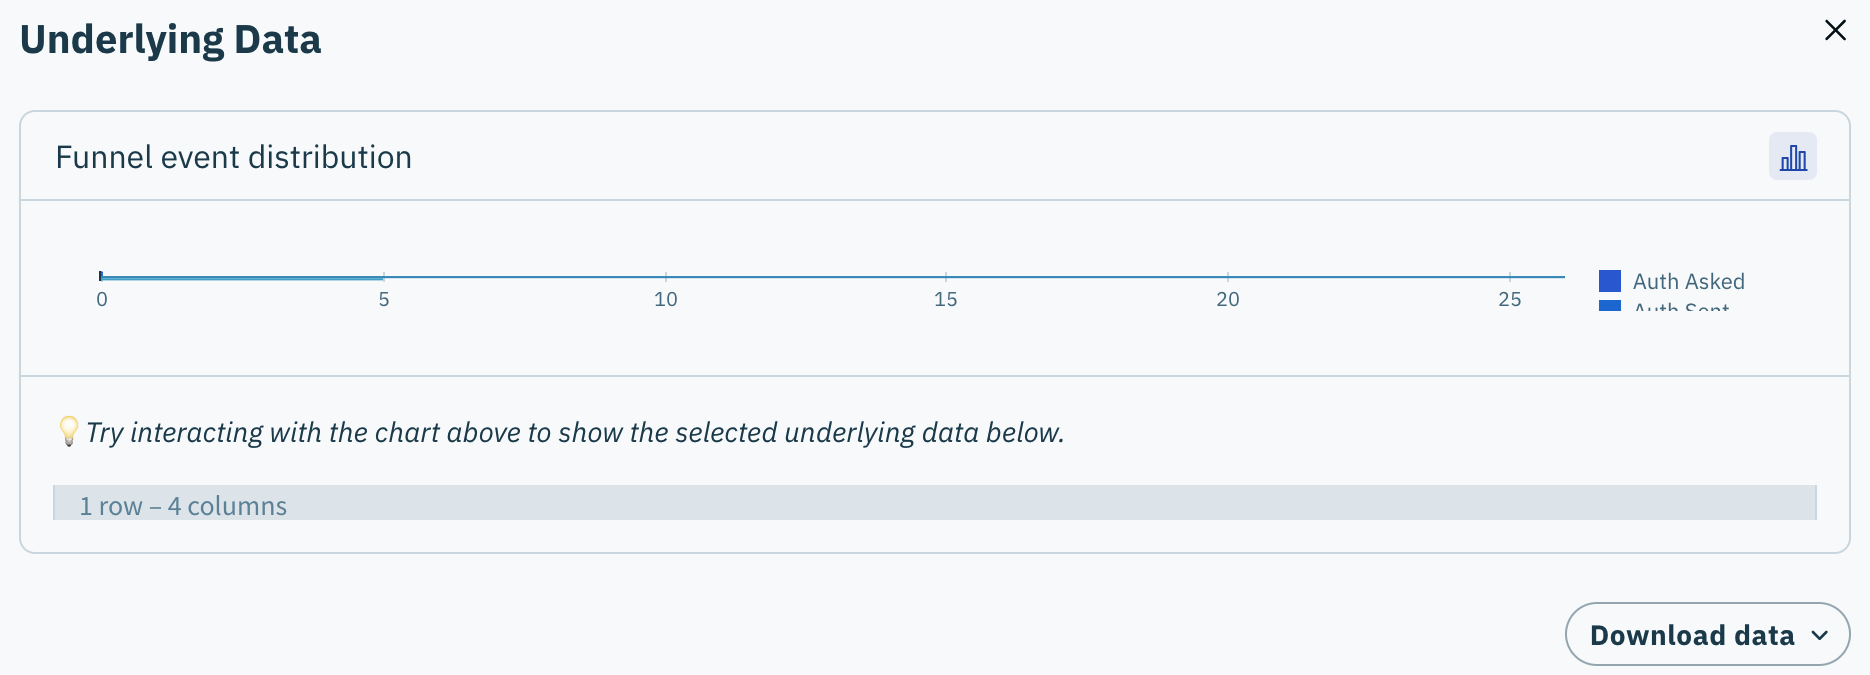
The subsequent window provides the underlying data used to generate the visualization.
{% hint style="info" %}
Interact with the chart in the window to further review the underlaying data for a particular trend, data point, etc...
{% endhint %}
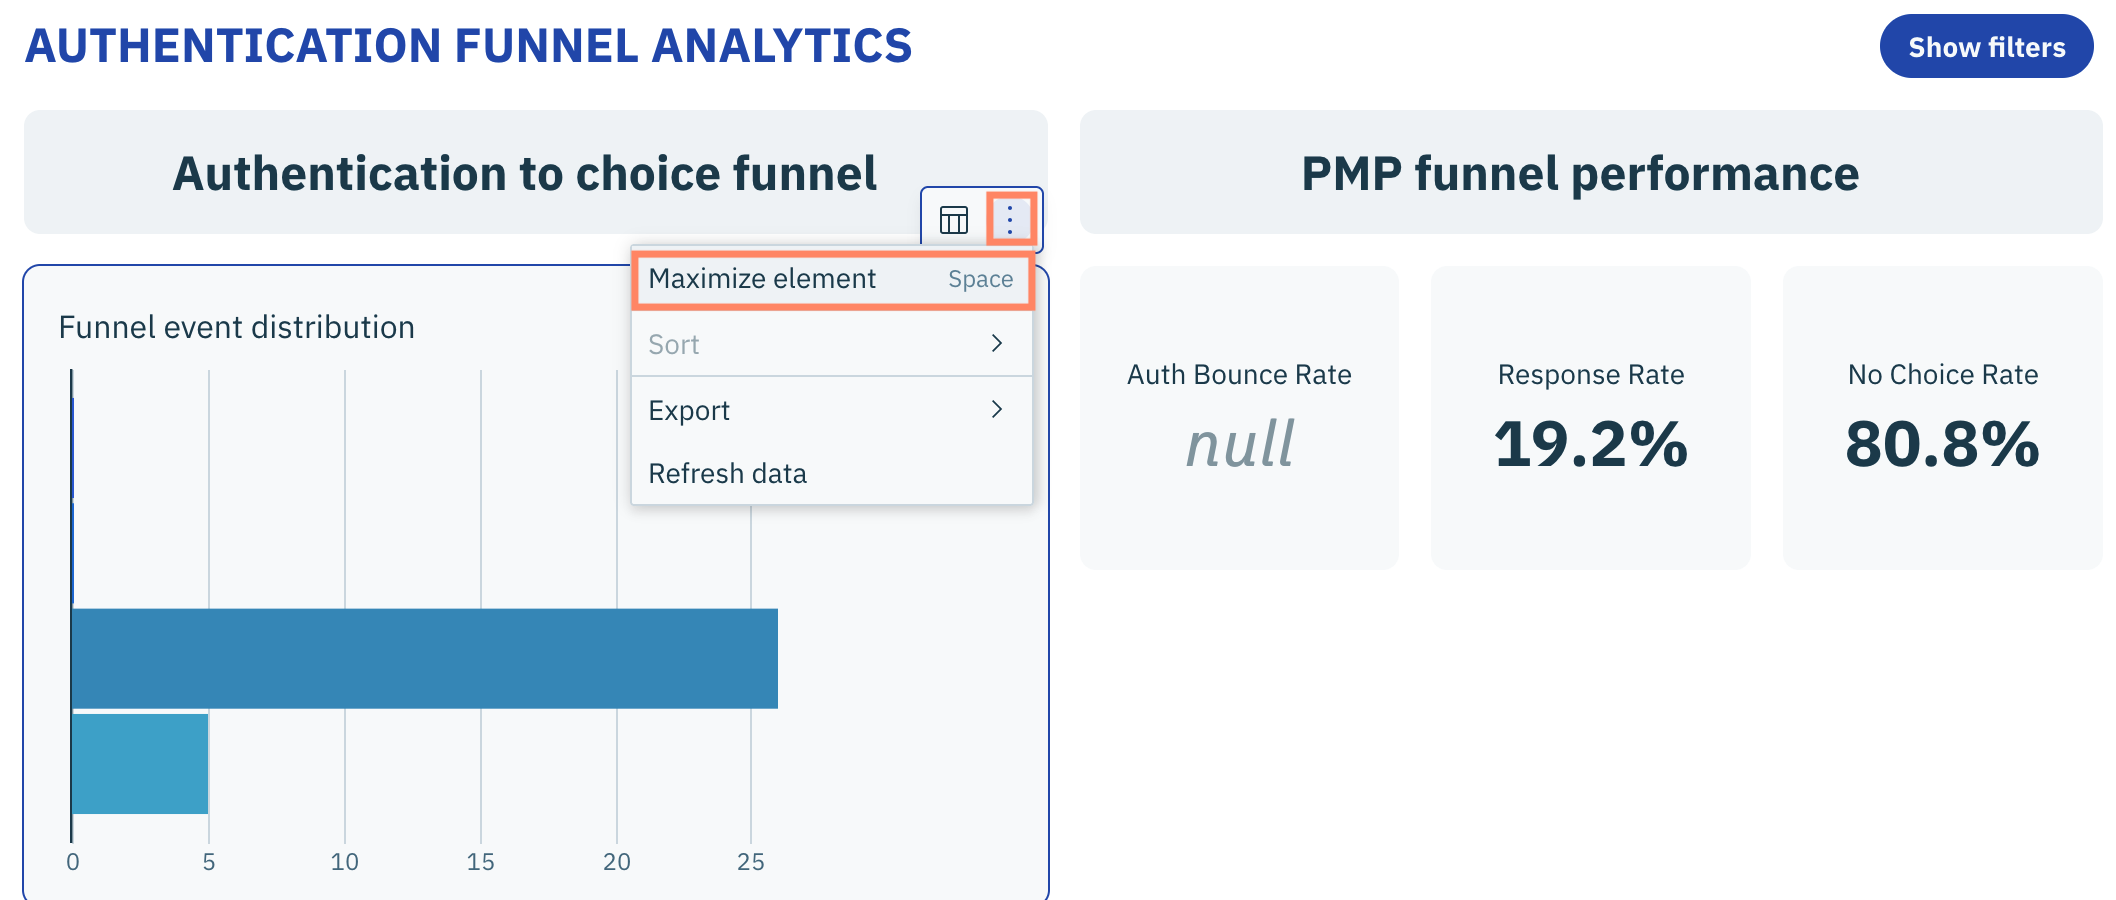
### Maximize element
Select the ellipsis icon from the action menu for the visualization and click **Maximize the element** from the subsequent menu.
The visualization will expand to a full screen view.
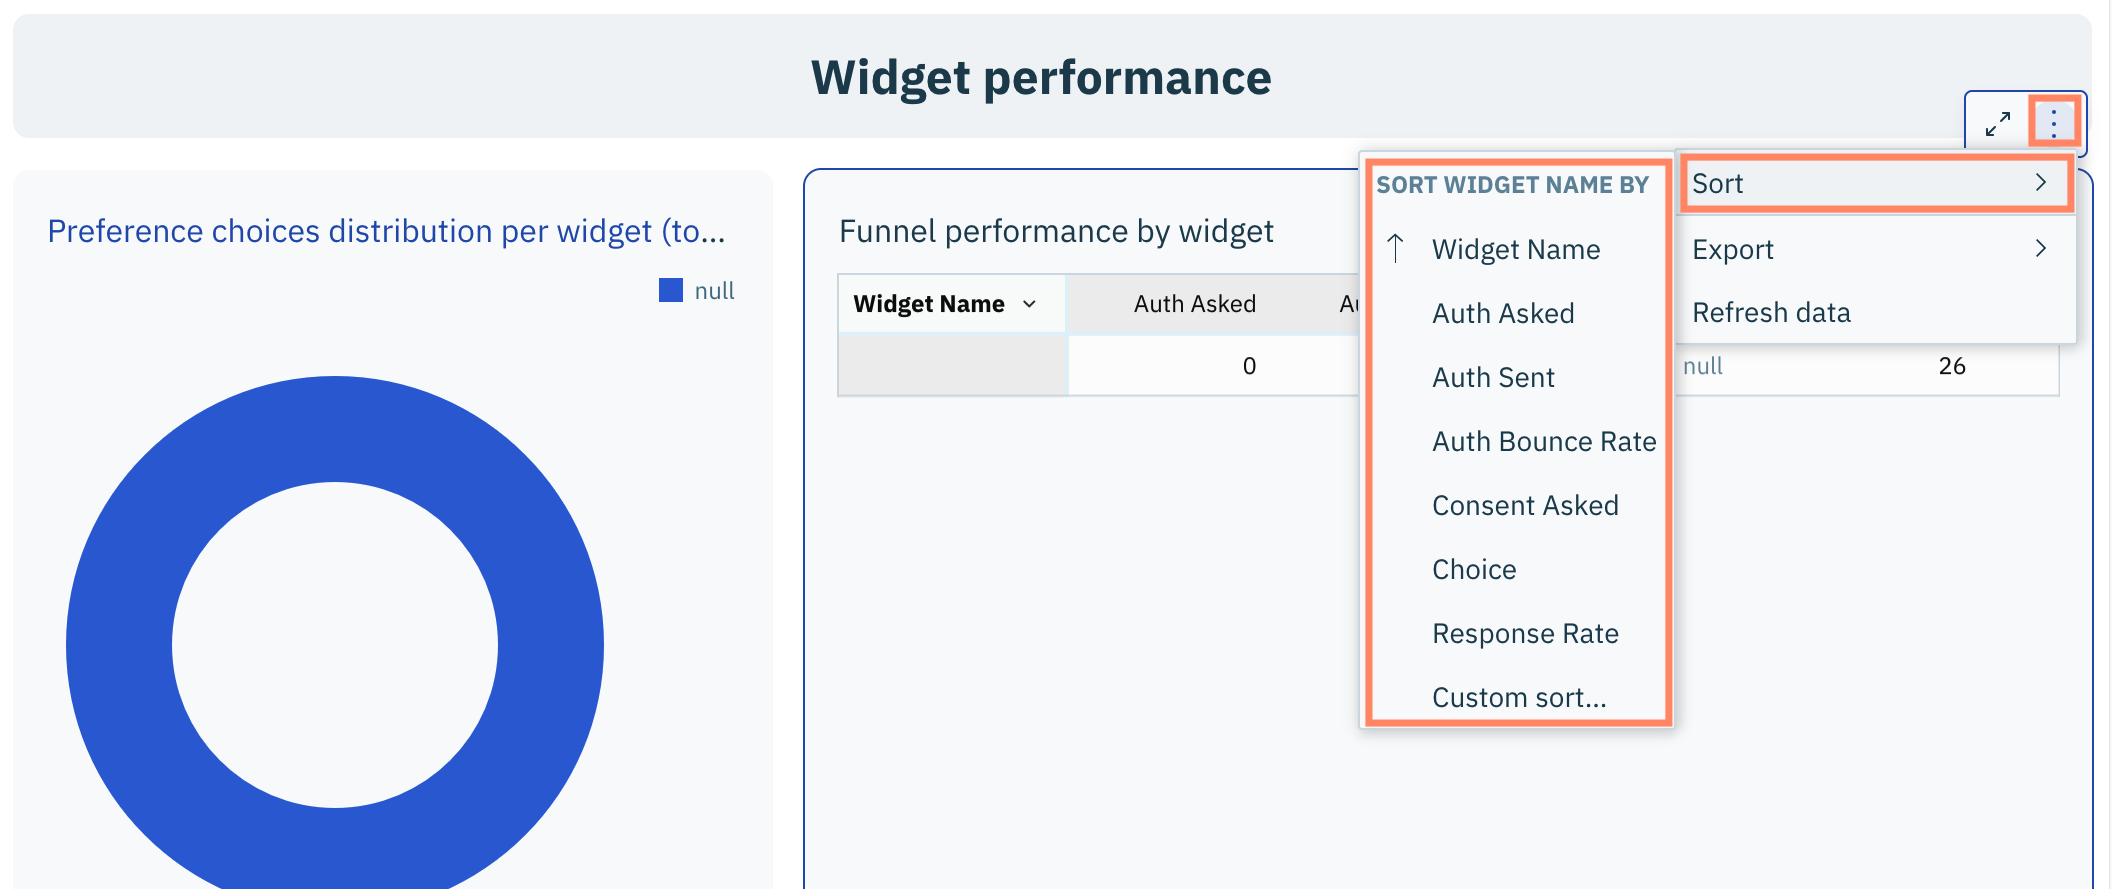
### Sort
Select the ellipsis icon from the action menu for the visualization and click **Sort** from the subsequent menu.
Click a parameter by which to sort the data.
The visualization will sort based on your specification.
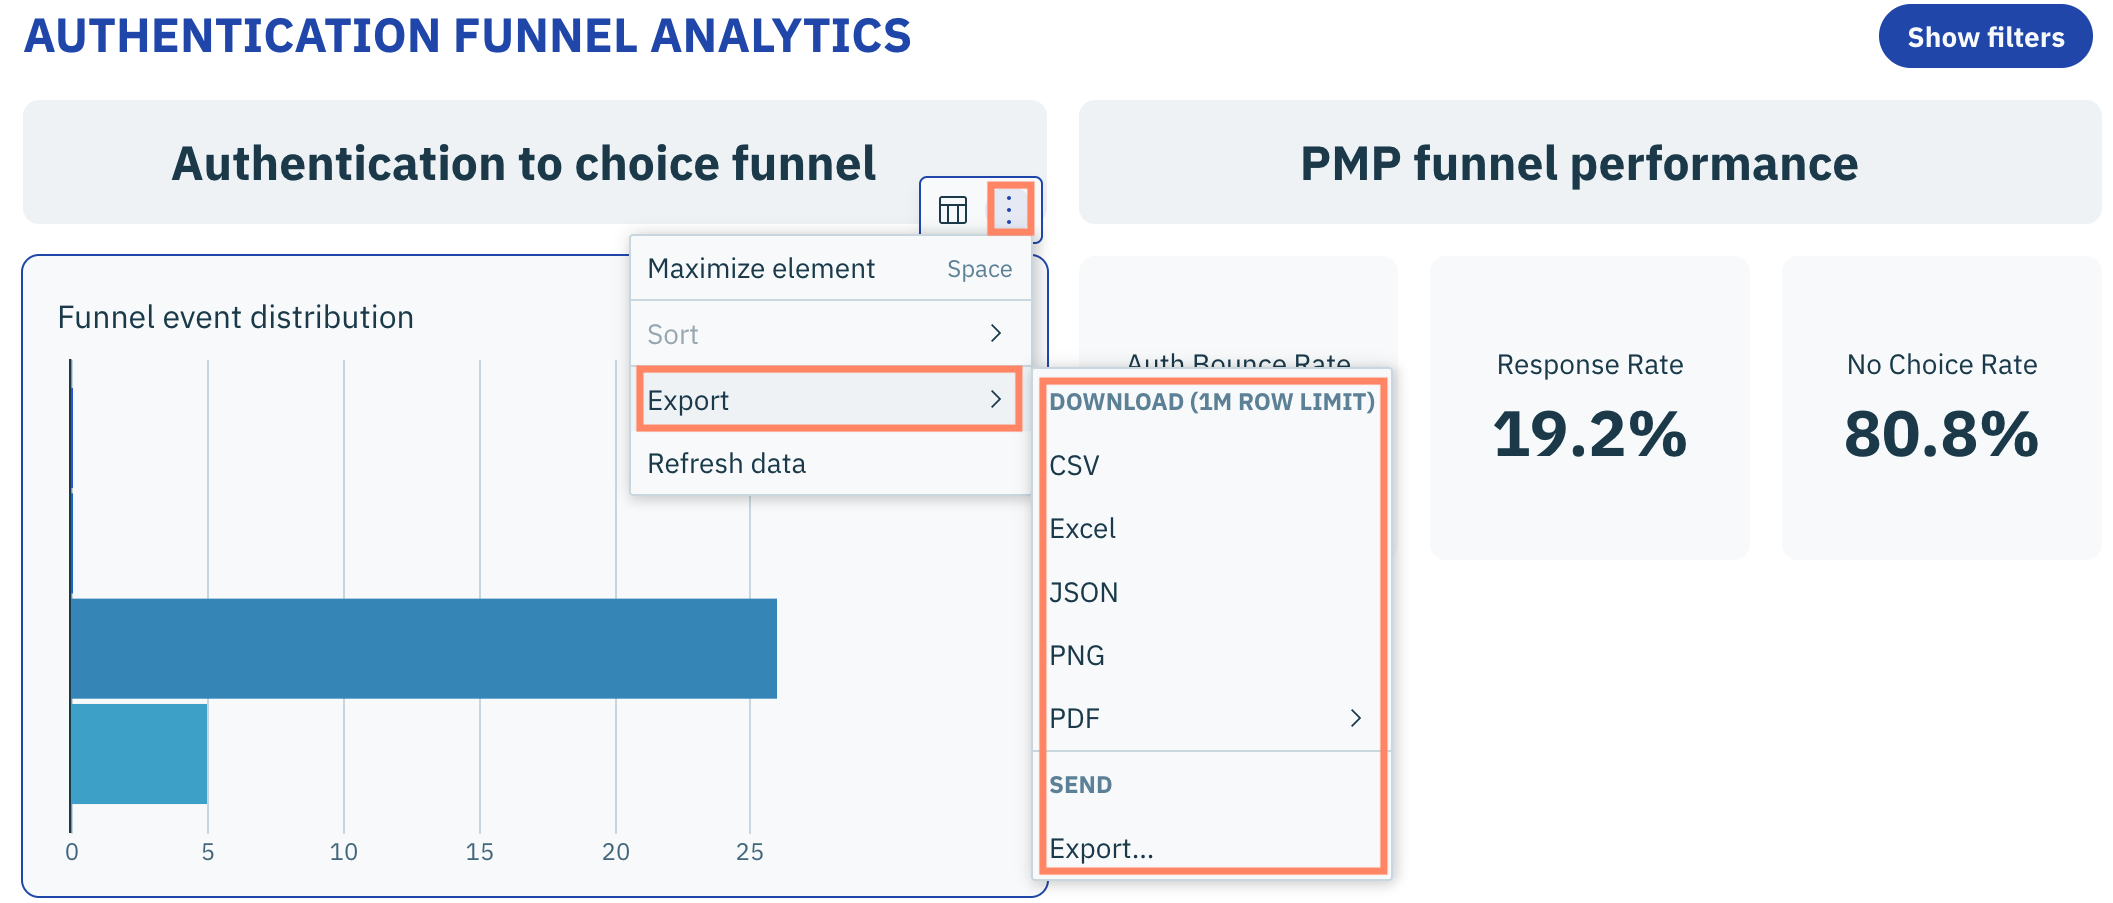
### Export/Download
Select the ellipsis icon from the action menu for the visualization and click **Export.**
From the subsequent menu, select the format you wish to receive the data.
The data will be downloaded onto your local machine in your specified format.
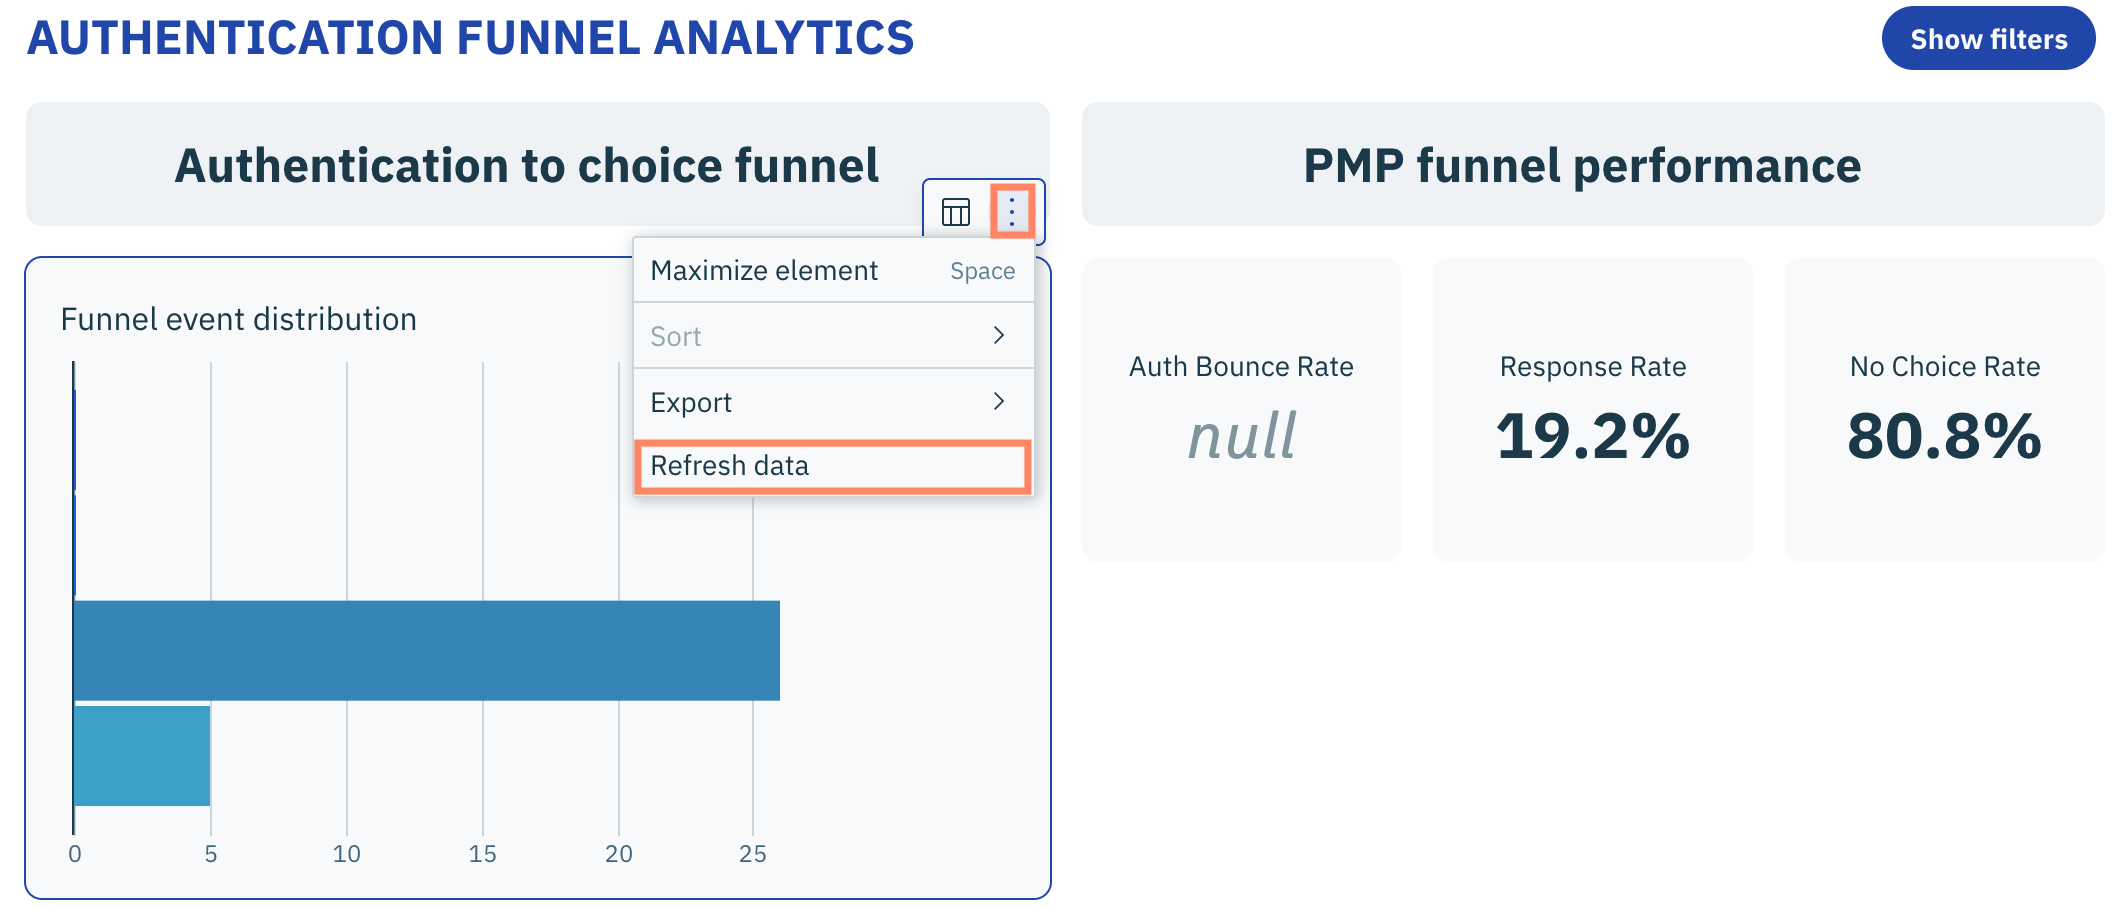
### Refresh data
Select the ellipsis icon from the action menu for the visualization and click **Refresh data** from the subsequent menu.
The data for the visualization will refresh.